
Editor’s Note: This absolutely fantastic piece on ECG findings in syncope has many ECGs. To get a better image click on the picture to to access the full size image at the LIFTL ECG library. A huge shout out and thanks to the folks at LITFL for compiling such a great library!
The Case
You are a medical student working in the emergency department when a 31-year-old man presents following a syncopal episode.
The patient had been working outdoors on a hot day. He sat for a rest, and when he stood up to return to work, he felt nauseated and clammy. A co-worker told him he ‘didn’t look so good’. A few seconds later, he lost his vision. He then passed out. After a few seconds, the patient returned to consciousness. He was alert and oriented, but still felt nauseated and “not quite right”.
When you see him in the emergency department, the patient says he feels entirely well. Your attending hands you the ECG and asks what you think.
Background
Syncope is a common presenting complaint in the emergency department, comprising almost 1% of all visits [1]. In many cases, the goal of ED management is to rule out a life-threatening cause for syncope rather than find a definitive diagnosis. The ECG is the workhorse of ED syncope work-up. Often, we don’t see any specific findings, but the syncope ECG is a place where sharp analytic skills can detect life-threatening conditions and make a big difference in patient outcomes. It’s important to know what to look for.
[bg_faq_start]Rate and Rhythm
Commonly, we approach the ECG starting with the rate and rhythm. Suppose your attending hands you an ECG that looks like this:

(Image courtesy of LITFL ECG library)
There are any number of ways to determine the rate. Here, we have five beats over a five second strip, giving a heart rate of 60 bpm. The first thing we notice about the rhythm is the mismatch between P waves and QRS complexes. In a normal ECG, we see one QRS for every P and vice versa; here, that is not the case.
Here, we see regularly-spaced P waves, so we know the atria is contracting in a regular manner. We have three narrow QRS complexes following three P waves, with a constant PR interval each time. Then we have a dropped QRS complex. Because these QRS complexes are narrow and follow associated P waves we know that these are atrial beats conducting down the AV node to the ventricles. If we had a longer rhythm strip, we’d see a regular pattern of 3 normally conducted QRS complexes each following a P wave, and then a fourth P wave with a missing QRS complex. This pattern of a dropped QRS complex tells us that we are dealing with 2nd degree AV block, which comes in two subtypes: Mobitz type 1 and Mobitz type 2.
In Mobitz type 1, the PR interval becomes longer with each conducted beat, until a beat is not conducted at all, and then the cycle repeats. Mobitztype 2, in contrast, displays a constant PR interval for all conducted beats. We’re focusing on type 2 here because it has a worse prognosis and is more likely to progress to complete AV block [1, 2]. If and when it does, the ECG may look like this:

Image courtesy of LITFL ECG Library

Image courtesy of LITFL ECG library

Image courtesy of LITFL ECG library
In each of these examples, we see the hallmark of complete AV block: regular P waves marching straight through regular QRS complexes. This makes the PR intervals variable. Complete heart block can cause syncope if the escape rhythm does not provide enough cardiac output, and it should always be considered in a case of syncope. Usually, the resulting ventricular rate is bradycardic. Complete heart block can be intermittent, typically on a background of Mobitz type 2 second degree heart block. If it is intermittent, the patient may only be symptomatic when they are in complete heart block.
Keep in mind other varieties of conduction system disease as well. High-grade AV block (having 3 or more P waves for every conducted QRS) and 2:1 AV block can both be caused by either second-degreeMobitz type 1 or second-degree Mobitztype 2 rhythms. In second-degree type 1 block the disease is in or above the AV node,and usually has a narrow QRS. In second-degree type 2 block, the disease is below the AV node in the distal conducting system, and so typically has a wide QRS. An old ECG can be useful to tell the difference between type 1 and type 2 in high-grade or 2:1 block. If the patient previously had type 1, then proximal conduction system disease (Mobitz type 1) is more likely the cause of their 2:1 or high grade AV block. Similarly, a long rhythm strip may show intermittent runs of lower grade AV block which may be more clearly type 1 or type 2., Response to atropine (AV node disease gets better, infranodal disease doesn’t) is another recommended trick to differentiate the two [1, 3].
In the case of extensive conduction disease, the term “trifascicular block” is sometimes used when there is evidence of disease in the right bundle branch, the left anterior and the left posterior branches of the His-Purkinje system. Most commonly, this means a right bundle branch block with a left anterior hemiblock, and a prolonged PR interval suggesting disease in the left posterior fascicle [4]. In the example below, we’ve got the typical right bundle branch block morphology in the anterior leads, the left axis deviation suggestive left anterior fascicular block, and first degree AV block.

Image courtesy of LITFL ECG library
In cases like these, extensive conducting system disease can be present despite a one-to-one correlation between P waves and QRS complexes. These patients are at risk of deteriorating into third degree AV block.
ECG Segments
After the rate and the rhythm, let’s take a look at individual segments of the ECG. We’ve already discussed prolonged PR intervals, but shortened PR intervals are important as well, especially in the setting of syncope. The big things to consider here are Wolf-Parkinson-White and Lown-Ganong-Levine syndromes, both of which can cause re-entrant tachycardia and cardiac syncope.
In Wolf-Parkinson-White, an abnormal branch of conducting tissue connects one atrium to the corresponding ventricle. The accessory pathway bypasses the relatively slow AV node and triggers a slower-spreading myocardially-conducted ventricular depolarization, which typically runs into the ventricular depolarization coming through the regular conduction system. Thisgives the ECG its trademark pattern – because the AV node is bypassed by the accessory pathway, the PR interval is shortened. Then the initial ventricular depolarization is slow, with a sluggish uptick, before it is eclipsed by the regularly conducted depolarization. The result is the delta wave, seen below [3].

Image courtesy of LITFL ECG library
Lown-Ganong-Levine is similar, to WPW, except that the accessory bundle is next to, or even within, the AV node [3,5]. Electrical activity bypasses the AV node, resulting in a short PR interval, but there is no slow ventricular depolarization to cause a delta wave because the depolarization continues down the normal His-Purkinje system.

Image courtesy of LITFL ECG library
Both of these syndromes create ideal conditions for a re-entrant tachycardia, where a feedback loop conducts a signal inappropriately quickly in a constant circuit between the atria and ventricles. In the case of WPW, where the accessory pathway is outside the AV node, it is called atrio-ventricular re-entrant tachycardia (AVRT), whereas if the AV node itself contains the accessory pathway (as in LGL), it is termed atrio-ventricular nodal re-entrant tachycardia (AVNRT). Occasionally, an ECG might capture the AVRT/AVNRT itself, which shows as a rapid regular tachycardia, usually consisting of narrow beats conducting anterograde down the AV node. Sometimes, it can appear as wide beats conducting retrograde up the AV node.
QRS Morphology
There are a few arrythmogenic conditions that present with abnormal QRS morphology. Of these, the Brugada syndrome is one of the most common [1]. Brugada is the result of abnormal cardiac sodium channel function, which can cause patients to spontaneously go into runs of ventricular tachycardia and fibrillation. If self-terminating, this may present as syncope. If not self-terminating, this may present as sudden cardiac death. There are a couple subtypes, and each has its own QRS morphology. Type 1 has the classic “coved” shape to the ST segment and inverted T wave, usually seen best in leads V1-V3. This type has a poor prognosis and is more likely to cause sudden cardiac death [6]. Type 2 has the “saddleback” ST segment elevation followed by a normal, inverted, or flattened T wave, and can confused with a normal variant ECG. Brugada is an important syndrome to check for on a syncope ECG, as catching it early allows for a lifesaving implantable cardioverter-defibrillator to be placed.

Image courtesy of LITFL ECG library
In the above, note the downsloping, biphasic ST stegment typical of Brugada Type 1.
QT Interval
After looking at the QRS complex, consider the QT interval. There can only really be two things wrong with the QT interval: too long, and too short. Too long, and the patient runs the risk of having the dreaded R-on-T phenomenon: a PVC occurs during the preceding T wave, setting off a run of polymorphic ventricular tachycardia called Torsades des Pointes. This can be self-terminating, causing a clinical presentation of syncope.
Long QT is defined by a corrected QT of greater than 450 ms for men, or 470 ms for women. There are a few formulas for calculating the corrected QT (“QTc”) from the observed QT and the heart rate, but a good rule of thumb (which only applies at normal heart rates) is that a QT interval longer than half a cardiac cycle is too long. Long QT can be either congenital, or acquired. Acquired is more common [3], and the culprits to keep in mind are antiarrythmic drugs (especially class I and 3), antipsychotics, antiemetics, antihistamines, and antibiotics – the “anti” drugs. Also consider whether your patient has low levels of potassium, calcium, and magnesium, or ischemic and hemorrhagic stroke, all of which can precipitate prolonged QT [1, 3].
Like Long QT syndrome, Short QT syndrome can be caused by genetic mutations, medications (especially digoxin, sympathomimetics) and electrolyte disturbances (hyperkalemia and hypercalcemia – again, the opposite of Long QT Syndrome) [3]. People with this are at much higher risk for atrial fibrillation, ventricular tachycardia/fibrillation, and sudden cardiac death than the general population [3].If these patients have a self-limited run of ventricular tachycardia, they may end up in the emergency department after a syncopal episode, where a sharp analysis of their ECG may save a life by leading to treatment of the underlying cause and/or implantable cardioverter. Short QT syndrome has a QTc of < 330 ms, and typically has tall peaked T waves immediately after the QRS with no ST segment [3]. See the example below:

Image courtesy of LITFL ECG Library
ST Segment
After we have examined the QT segment, we focus in on the ST segment. While myocardial infarction and pulmonary embolism are less common causes of syncope, particularly in the absence of other symptoms, they are potentially fatal and must not be missed. Look for ST segment elevations or depressions that might clue you in to an MI. Also look for ECG findings suggestive of PE. Some of the more common findings are sometimes called the “right ventricular strain pattern” and include tachycardia, T wave inversions in V1-V3 and inferior leads, and RBBB morphology [1, 7].

Image courtesy of LITFL ECG library
The “classic”appearance of the ECG in pulmonary embolism is sometimes called S1Q3T3 – a pronounced S wave in lead I, with Q waves and T wave inversions in lead III. Be warned, however: it is not sensitive, so the absence of S1Q3T3 means nothing at all, and while it is reasonably specific, the ECG alone can’t make the diagnosis of PE [1, 8, 9, 10].

Image courtesy of LIFTL ECG library
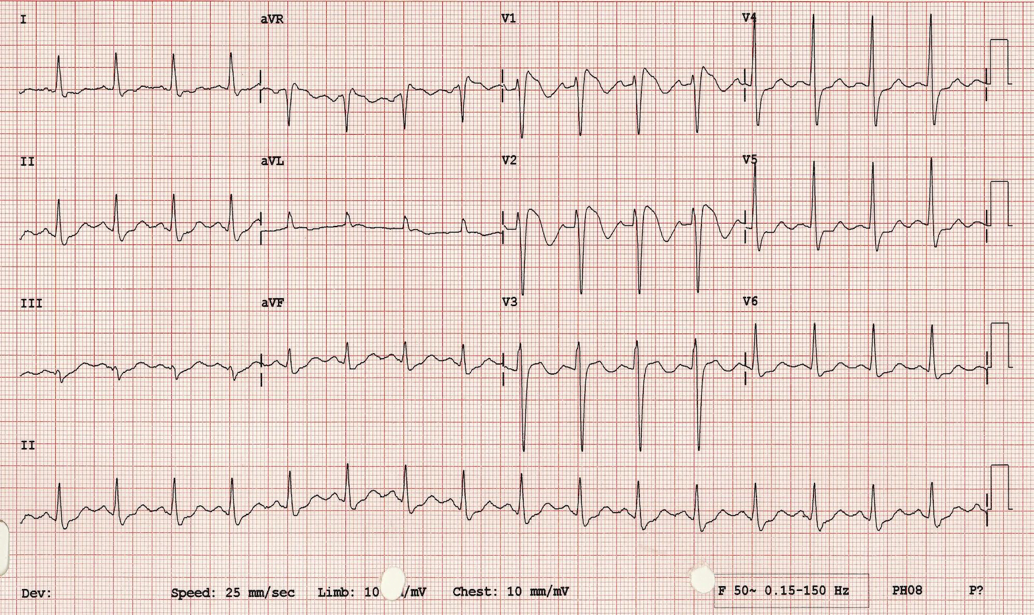
The Case Revisited
So what about this case? Returning to the patients ECG, you take a thorough, systematic approach, looking for:
- Rate and rhythm, looking for AV block particularly
- Axis, looking particularly for any deviations suggestive of RBBB or hemiblocks
- QRS and ST segment morphology, looking for delta waves, ST segment and T wave changes suggestive of Brugada, MI, or PE, and checking again for bundle branch morphologies
- Intervals, including PR intervals and QT intervals.
In this otherwise healthy young man, you find a normal ECG. Unexciting, but common. Since his physical exam and other investigations are also normal, he is discharged home with a diagnosis of vaso-vagal syncope.
Take home points
- The ECG is a key part of a syncope work-up.
- Always consider life-threatening causes of syncope, including MI and PE
- Have a systemic approach to syncope ECGs that includes:
- Bradyarrythmias and conduction system disease
- QRS and ST segment morphologies
- PR and QT segments
References
- Marx, John A., Robert S. Hockberger, and Ron M. Walls. Rosen’s Emergency Medicine, 8th Ed. Philadelphia: Saunders Elsevier, 2014.
- Burns, Ed. Life in the Fast Lane – “AV Block: 2nd Degree, Mobitz II”. http://lifeinthefastlane.com/ecg-library/basics/mobitz-2/ (accessed April 2, 2015).
- Das, Mithilesh K. , and Douglas P. Zipes. Electrocardiography of Arrythmias: A Comprehensive Review. Philadelphia: Saunders Elsevier, 2012.
- Burns, Ed. Life in the Fast Lane ECG Library – “Trifascicular Block”.2014. http://lifeinthefastlane.com/ecg-library/trifascicular-block/ (accessed April 02, 2015).
- Life in the Fast Lane ECG Library: Pre-Excitation Syndromes. http://lifeinthefastlane.com/ecg-library/pre-excitation-syndromes/ (accessed April 03, 2015).
- Marine, Joseph E. “ECG Features that suggest a potentially life-threatening arrythmia as the cause for syncope.” Journal of Electrocardiology, 2013:46(6): 561-568.
- Oullette, David W, and Patocka, Catherine. 2012. Pulmonary Embolism. Emergency Medicine Clinics; 30(2): 329-375. Link
- Marchick, Michael R., et al. 2010. 12-Lead ECG findings of pulmonary hypertension occur more frequently in emergency department patients with pulmonary embolism than in patients without pulmonary embolism. Annals of Emergency Medicine; 55 (4): 331-335. PMID:19766353
- Rodger, M, et al. 2000. Diagnostic value of the ECG in pulmonary embolism. Diagnostic value of the electrocardiogram in suspected pulmonary embolism.American Journal of Cardiology; 86(7): 807.PMID: 11018210
- Witting, Michael, AmalMattu, Robert Rogers, and Christian Halvorson. 2012. Simultaneous T-Wave Inversions in Anterior and Inferior Leads: An Uncommon Sign of Pulmonary Embolism. Journal of Emergency Medicine; 43(2) : 228-235. PMID:22142671

David Wonnacott
Latest posts by David Wonnacott (see all)
- Isolated distal DVT – Diagnosis and Management - March 21, 2017
- Medical Concepts: Abdominal Pain Labs - November 9, 2015
- Medical Concept: ECGs in Syncope - September 21, 2015
Latest posts by BoringEM (see all)
- Pre-Game: CaRMS Interview Preparation - December 20, 2017
- Tiny Tips: SALTR for Pediatric Growth-plate Fractures - May 20, 2016
- Does that condition require investigation? - May 10, 2016