
A large part of an emergency physician’s job is finding and ruling out emergencies. To do that we ask the patient questions, examine them, look at their blood, and take radiographic images. The goal of all of these tests is to rule-in or rule-out disease. However, not all tests are created equal…
As a student, I became frustrated when I was told that such-and-such test was “good” and I should use it. What did good mean? Is a good test always right? I like statistics and percentages, but these tests were presented with a hazy diagnostic foundation that I found unsatisfying. It jarred with the evidence based medicine that I was, in the same breath, being told I should practice. When I discovered the power of likelihood ratios (LRs) things started to make much more sense.
Any discussion of a test’s diagnostic power requires a working understanding of LRs and basic statistics. Ten years ago, LRs required calculations or a Fagan nomogram to be used effectively. Fortunately, there are now tools out there that do the math for you. However, these tools still require some statistical know-how.
Following a brief statistical interlude, this post will teach you how to 1) determine the diagnostic strength of common tests and 2) how to use likelihood ratios in real world situations.
Statistical interlude
To use likelihood ratios effectively you need to understand these 5 points:
1. Every patient that walks through the ED doors with a complaint has a probability of having any number of diseases. This is called the pre-test probability.
2. We perform tests on patients to increase or decrease the probability of them having each possible disease. A test’s ability to increase or decrease the probability of a certain disease is given by the likelihood ratio. Likelihood ratios can be calculated for positive and negative test results using the sensitivity and specificity.
Positive likelihood ratio = Sensitivity / (1 – Specificity)
Negative likelihood ratio = (1 – Sensitivity) / Specificity
Whereas sensitivity and specificity tell us how good a test is when the patient already has (sensitivity) or does not have (specificity) the disease in question, likelihood ratios tell us how much a positive or negative test result affects the likelihood of a disease when we do not know if they have it or not! This is why they are superior to sensitivity and specificity for clinical reasoning (read more about this on a previous BoringEM post).
3. A positive test result usually increases a disease’s post-test probability. The greater the positive likelihood ratio, the greater the post-test likelihood of disease. Positive likelihood ratios range from one to infinity. A negative test result usually decreases a disease’s post-test probability. The smaller the negative likelihood ratio, the less likely the post-test probability of disease is. Negative likelihood ratios range from zero to one.
4. No test is perfect and whether a test influences our clinical decision making in a particular situation depends on the severity of the disease and the pre-test probability, not necessarily how big or small its likelihood ratios are.
5. Tests can only be used one after one another in specific situations. Whether they can be “added” together depends on whether they are dependent upon one another.
For example, hearing rales on exam increases a persons chance of having a pneumonia, as does egophony. If an individual has both does that mean that we can use the first test’s post-test probability as the second’s pre-test probability? Not necessarily: these variables could be dependent on one another. Most patients with egophony might also have rales (meaning they are basically the same test) which would make it erroneous to add them.
When can we add tests? Often we must rely on our intuition. An x-ray has little to do with a stethoscope finding so we would probably be able to use the post-test probability of hearing rales for pneumonia as the pre-test probability for the test of an x-ray finding a consolidation. In other cases we may have a decision rule that has already correctly amalgamated the tests and accounted for any interdependence with the magic of math. The Heckerling score for pneumonia is such a decision rule.
The problem – and the solution?
This sounds great in principle, but in practice we rarely speak in post-test probabilities and LRs. I think this is because they are hard to remember, there are so many of them, and there was, until recently, no easy way to access them. That is why I created my iOS app, DxLogic, and website, LRDatabase.com. The following examples will demonstrate how you to can use this resource to approach some common medical emergencies in a probabilistic and rational manner. The screenshots found below are from the iOS application.
[bg_faq_start]Example 1
A 86 year old gentleman walks into the ED complaining of recent onset chest pain. Because he’s an ED patient in his late 80’s with a presenting complaint of chest pain he has an approximately 12% chance of having an MI. Thus, his pre-test probability of MI is 12%.
How do I know this?
My app and website contain a database of likelihood ratios and disease prevalences. If you click on ‘prevalences’, select the presenting complaint “chest pain, non-traumatic” and then the > 85 age group you will get the appropriate statistic and its reference in the literature.

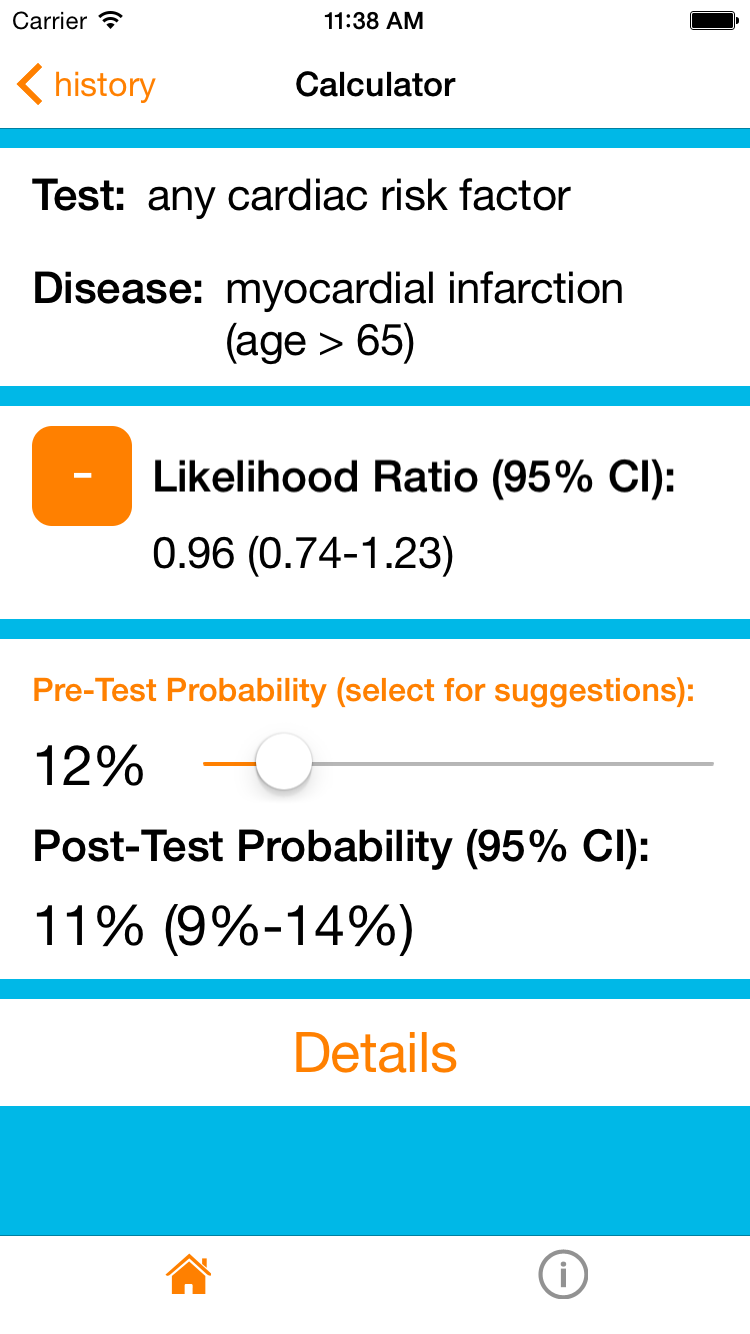
12% is a substantial risk for a potentially deadly condition so we will need to do some investigations to rule it out. In this situation we commonly ask about cardiac risk factors (diabetes, hypertension, current smoker, hypercholesterolemia, and family history of premature coronary artery disease in a first-degree relative) while other testing (ECG’s, cardiac enzymes, etc) occurs.
It turns out that he does not have any cardiac risk factors. The resource can now calculate the post-test probability. Setting the pre-test probability to 12% and selecting that he has no cardiac risk factors in the age > 65 subgroup gives us a final post-test probability of 11%. In other words, the absence of cardiac risk factors in a patient aged > 65 does not change his probability of having an MI! In this context, asking about cardiac risk factors was not a very good test.
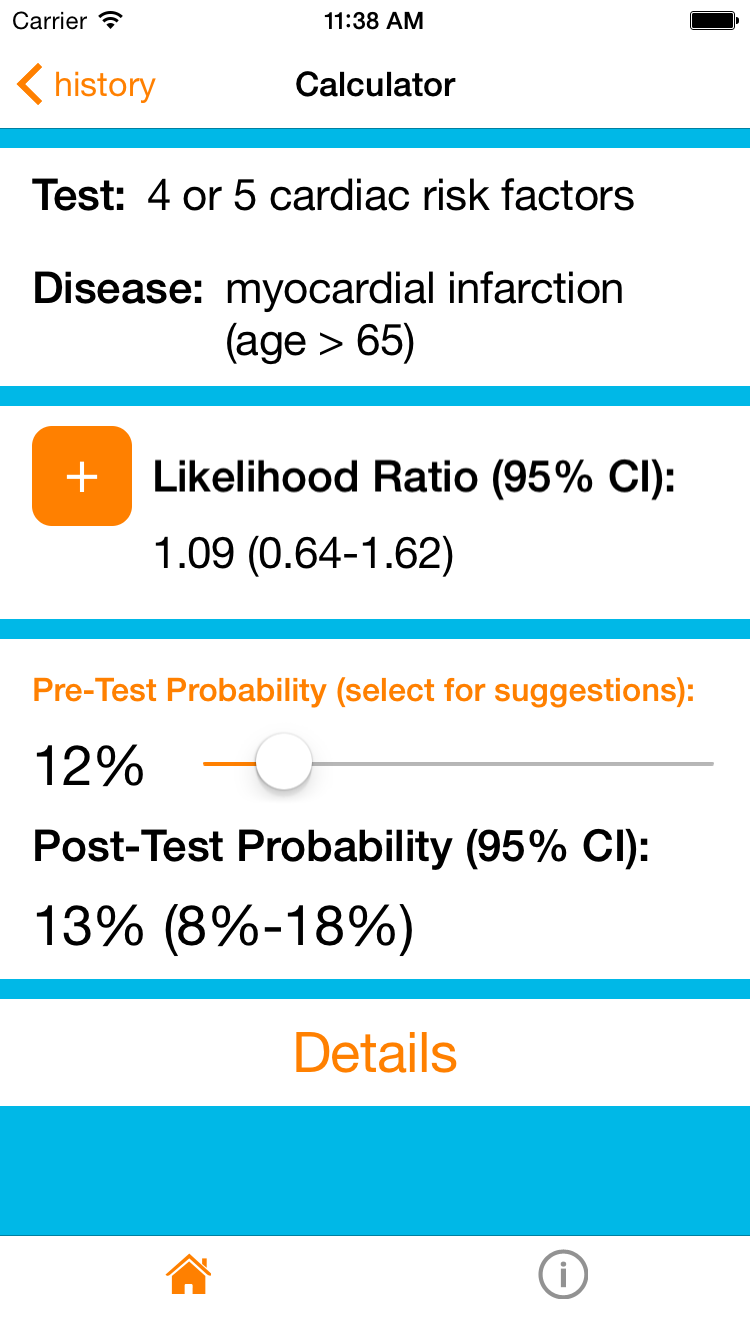
Interestingly you can also see that even the presence of 4 or 5 cardiac risk factors doesn’t increase his probability. In an elderly patient cardiac risk factors really don’t matter.
Example 2
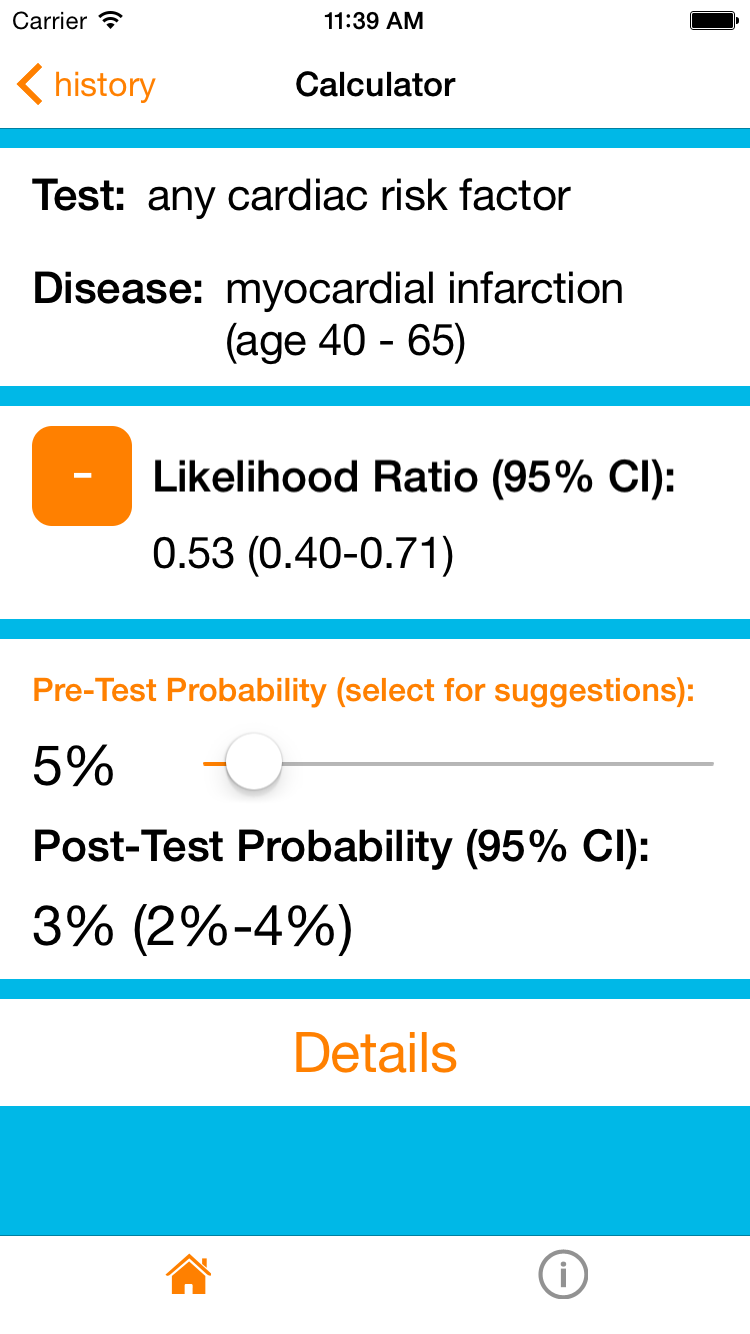
But what if the patient was fifty-six and has no cardiac risk factors? If we were to repeat our steps but for the age 55-64 group (~5% pre-test probability, and -LR any cardiac risk factor ~0.5) we would find that the post-test probability of an MI is now 3%. This is not a complete rule-out but a borderline low probability. I would still feel the need to order additional testing (a normal ECG and troponin would lower his risk even more!), but using this app/website can provide real numbers for a discussion with our patients about their risks. Already we can inform him that their chance of having an MI is about 3% – a solid statistic that will allow him to participate more fully in his ongoing care.
Example 3
Let’s shift gears to demonstrate point #4 from the statistical interlude. A fifty-five year old woman presents with a new cough, runny nose and sore throat. Her grand-daughter has been sick all week with similar symptoms. A family friend recently died from a pulmonary embolism and she is quite concerned that she might be having one. A d-dimer was ordered to alleviate her concerns and came back positive. A CT-PE study was then done which showed a single segmental PE. Case closed, right?
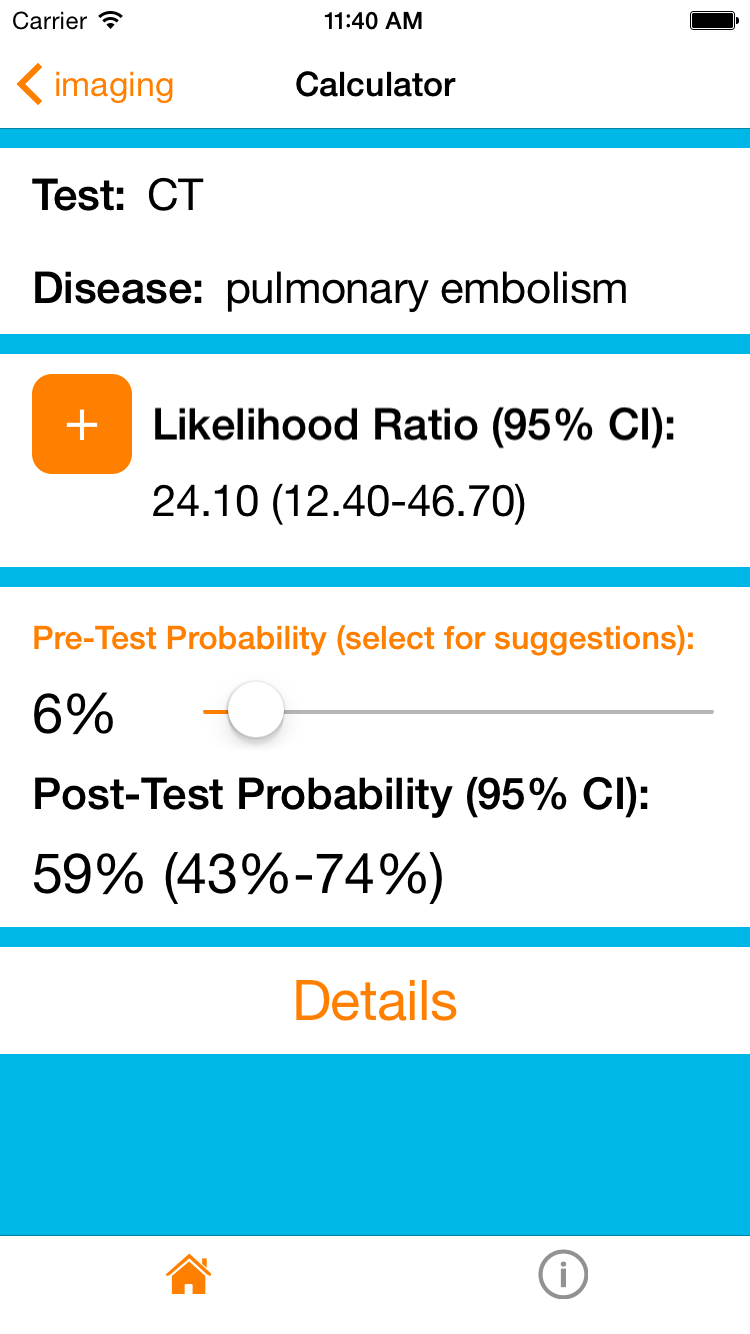
You’re gut is probably questioning this conclusion, and this is why. First, the presentation is atypical for a pulmonary embolus. She’s over 50, so the PERC rule is not negative, but her Well’s score is low, giving her a 6% pre-test probability of pulmonary embolus. Her pre-test probability would probably be even lower because the Well’s score was validated in an ER population suspected of having PE and most physicians would not suspect a PE in this case. However, we will allow this conservative overestimation and use it as our pre-test probability.
CT-PE is a very good rule-in test, but no test is perfect (unless it’s the gold standard) and its average likelihood ratio is 24 (high, but still a far way from infinity). This gives a post-test probability for PE of about 60%. This also means that the chance that this woman has a diagnosis other than PE is 40%! That’s almost 50-50!!
So, before we start her on lifelong anticoagulation, we may consider further testing (e.g. the gold standard, angiography) or getting her close follow up with a specialist to consider her case further. In this case, despite how ‘good’ of a test a CT-PE is, it still leaves us with a lot of uncertainty due to the low pre-test probability in this case.
Conclusion
There are thousands of tests out there. Sometimes it feels like the hospital is a test factory with poor quality control. However, selecting the most useful tests for a given situation can both save time time and avoid unnecessary and potentially harmful tests. I hope this article has made you aware of the important role that likelihood ratios can play in everyday practice. By quantitatively understanding what a test does to a patient’s diagnostic probabilities we can relay information to patients to help them confidently participate in the decision making process.
While you are investigating the wonderful world of likelihood ratios, please consider giving my app and website a try (and tell your friends!). I am always open to feedback so if you have any on the app or this article, please contact me!
Reviewing with the Staff | Dr. Heather Murray
Dr. Murray is an Associate Professor of Emergency Medicine at Queen’s, and holds a cross-appointment in the Department of Community Health and Epidemiology.
Likelihood ratios (LRs) are not intrinsically easy to understand, but they are critical for correctly interpreting test results. Most clinicians understand the concept of sensitivity and specificity, at least well enough to know that highly sensitive tests rarely miss disease (and effectively rule out disease) while highly specific tests are rarely falsely positive (and effectively rule in disease). However the problem with sensitivity and specificity is that they are properties of the test. So, while knowing these test properties can help us select the right test to perform, they do not tell us what to do once we have a result.
Many studies and clinicians talk about positive and negative predictive values, or the chance that the test is correct. There are problems with this. First, PPV and NPV change as the prevalence of disease changes. For example, as fewer people in your study population have the disease (decreasing prevalence), the negative predictive value of the test will go up. If we hear that a test has a 99% NPV, that sounds good, but this is only helpful if you know the pretest probability of the disease in your patient. If your patient’s pretest probability of disease is higher than the population studied, their NPV (or risk of a false negative test) will be lower. This is why I discourage students and residents from talking about the PPV and NPV – they are a moving target with an unclear application.
The likelihood ratio is the best option for interpreting test results. When you are faced with a positive test result, the real question is whether your test is a true positive or a false positive. If the positive LR of the test is 9, that means that there are 9 true positive test results for every 1 false positive – pretty good! But a positive LR of 2 means that there are only 2 true positives for every 1 false positive – not as reassuring. The positive likelihood ratio is literally the ratio of the true positive results to the false positive results in a given test, and it is stable (unaffected by pretest probability).
The negative likelihood ratio is a bit trickier since you are starting with a negative premise, and end up with a number less than 1 to interpret. The negative LR asks about the ratio of false negative tests to true negative tests (or “is this negative test messing with me?”). Ideally this should be very small. So a negative LR of 0.1 has 1 false negative for every 10 true negatives (or 1/10) while a negative LR of 0.5 has 1 false negative for every 2 true negatives (1/2).
The beauty of these is not only the stability and more intuitive application (once you understand them), but the mathematical ability to combine them with pre-test probability estimates for a concrete post-test probability, as Michael Garfinkle has shown here with his post, website, and app. Try them out and embrace the likelihood ratio as the powerful practical tool that it is.
This piece was edited Dr. Brent Thoma

Latest posts by Michael Garfinkle (see all)
- Doctors Can’t Remember Everything: Calciphylaxis and a Diagnostic Aid - February 24, 2022
- Volume Assessment: What’s voodoo and what’s vital? - April 12, 2016
- Boring Question: What is the risk of Contrast-Induced Nephropathy? - June 22, 2015
Latest posts by BoringEM (see all)
- Pre-Game: CaRMS Interview Preparation - December 20, 2017
- Tiny Tips: SALTR for Pediatric Growth-plate Fractures - May 20, 2016
- Does that condition require investigation? - May 10, 2016