
It’s your first day as a clerk in the Emergency Department and your staff has asked you to see an 80 year old patient with known COPD presenting with increasing shortness of breath. He reminds you to check the patient monitor when you go in there to look for any abnormalities and to record a new set of vitals on the chart.
Patient monitors can be overwhelming early in your training when you’re not quite sure what you’re looking at. There are so many numbers, waveforms, and sounds – how are you supposed to know what is what? When you’re in a busy Emergency Department, it is important to be familiar with what a typical patient monitor looks like and how to interpret all of the components. Knowing the basics of patient monitor interpretation and ECG lead placement can make a junior clerk a valuable member of the Emergency Department team.
Here is an example of a patient monitor. The typical layout includes the numerical vital signs on the right and the waveforms on the left, giving you a general overview of the patient’s real-time vitals.
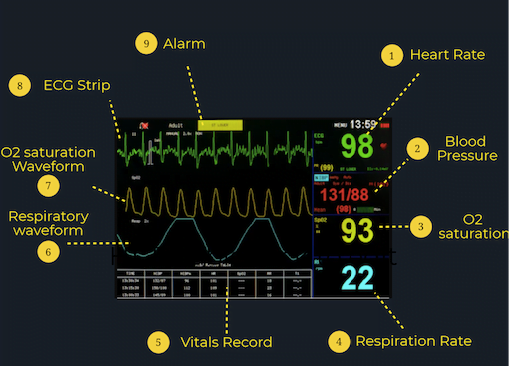
What the Numbers Mean:
Various patient monitors can record and track a wide array of information, but almost all patient monitors will record these key vital signs:
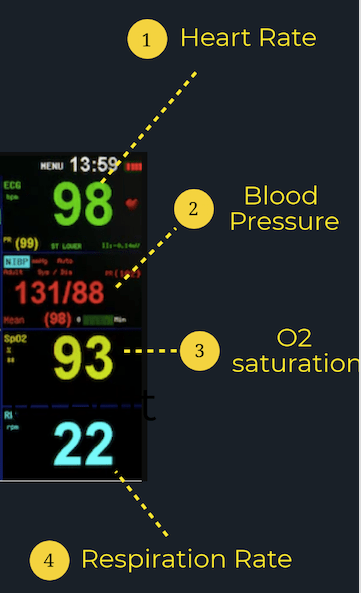
Heart Rate (HR): Typically, the heart rate is presented at the top of the monitor in green. The number will be identified by a “HR” or “PR” (pulse rate) beside or just above it and is presented in beats per minute (bpm). A normal adult has a resting heart rate between 60-100 bpm.
Blood Pressure (BP): The patient’s blood pressure is typically presented on the screen under “SYST” or “SYS” for systolic and “DIAS” or “DIA” for diastolic. An average BP is around 120/80.
Oxygen Saturation (SpO2): The patient’s oxygen saturation will be located on the monitor under “SpO2” and is a measure of the amount of oxygen in the patient’s blood. A normal O2 saturation is 95% or greater; however, it is important to remember that some populations such as those with COPD have a lower normal cutoff.
Respiratory Rate (RR): Look for the patient’s respiratory rate under “RR” on the patient monitor. It is reported in breaths per minute, with normal values between 12 and 20. However, this number isn’t very accurate, especially as the patient’s breathing goes faster or slower.
What the Lines Mean:
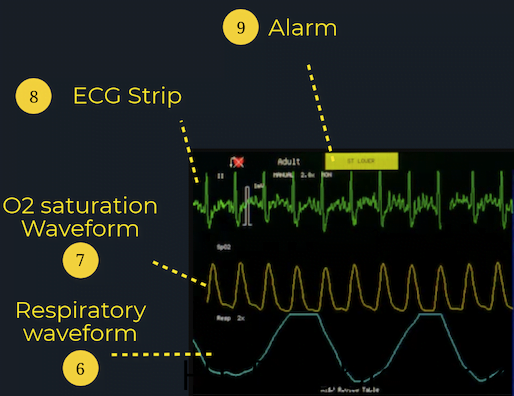
ECG Readout:The ECG readout on the patient monitor is not intended for detailed ECG analysis as it typically only represents one lead (most commonly lead II). Instead, it is most useful for guiding acute resuscitations or managing arrhythmias, since it can give you some information on the electrical activity of the heart and its level of function. If you have any concerns regarding a patient’s cardiac function, get a 12-lead ECG! Knowing the proper lead placements for 5-point cardiac monitors and 12-lead ECGs is also an important skill for junior learners in the ED. For resources to review lead placements, check out the CanadiEM Frontline Primer or this blogpost by Life in the Fast Lane for an in-depth explanation.
SpO2 Waveform: The SpO2 waveform allows clinicians to determine whether there are any issues with circulation or peripheral perfusion. Each peak of the SpO2 waveform should correlate with a heartbeat on the ECG waveform at the same intervals, since oxygenated blood is being pumped out of the heart with each heartbeat.
Respiratory Waveform: The “RESP” waveform on the monitor is useful for clinicians to monitor for any respiratory issues such as apnea or dyspnea.
What the Alarm Means:
If any of the vital signs fall outside of the range of normal, the patient monitor will alert clinicians by sounding an alarm and flashing an alert on the screen. Although the alarm may indicate a serious issue such as a sudden drop in O2 saturation or BP, it is important to note that just because the alarm is going off doesn’t always mean that there is a clinical problem. One of the most common reasons for the alarm to go off is because one of the sensors isn’t receiving information. The screen may show no reading, a fluctuating numerical value or waveform, or a reading that does not correspond with the clinical picture. Always make sure that all of the wires and probes are properly attached and secured! It’s also common for the alarm to suggest Vfib but the patient could just be moving (or seizing). However, if you are ever concerned with the values or readouts that are being presented on the patient monitor, check your patient and find your senior resident or staff as soon as possible. It’s better to be safe than sorry!
Lastly, junior learners sometimes make the mistake of focusing too much on one abnormal number. If one vital sign lies outside of the normal limits, this may indicate a problem; however, it could also be an outlier. Remember that a patient’s HR may be elevated due to pain, white coat syndrome, or strong emotions. Similarly, a BP may change due to the patient’s position or hydration status. As a result, it is important to remember to always interpret the vital signs together and in the context of the patient’s clinical picture and consider many possible explanations for why the vitals are abnormal.
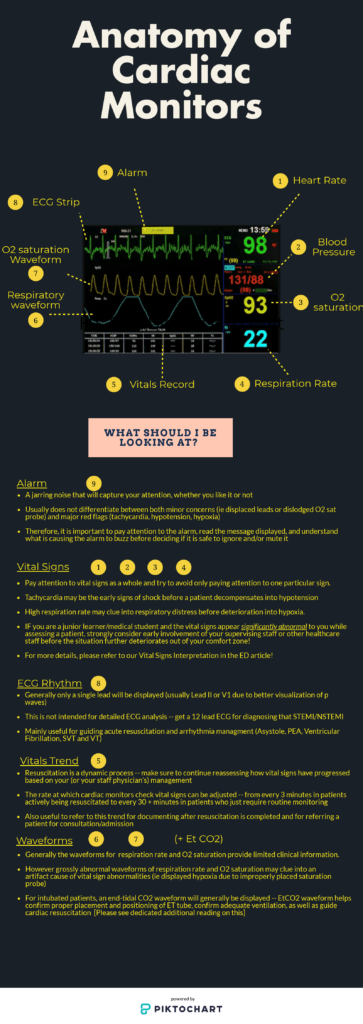
Download this infographic to keep with you in the ED or on the wards for a quick refresher on the go!
Reviewing with the Staff
I have a love/hate relationship with the monitor. I remember as a junior medical student my first day on pediatrics when I was caring for a 6 month old boy. During my rounds, the monitor suddenly started alarming. His heart rate was 140! My expression frightened his mom and she and I rushed outside to grab the nurses and a pediatrician. Turns out 140 is only the upper limit of characters for tweets and is perfectly normal for that age range. I was led astray by that monitor and it spawned a decade long feud.
Now I’ve come to appreciate it a little more; with familiarity I’ve learned that the alarms are a reminder for you to check the patient. Remember any number that doesn’t fit with what you’re seeing needs further investigation. The automated BP can be influenced by a number of factors, but sometimes that single low reading might be a message. I had a 80 yo male with 1 reading of 60/40 and then every subsequent reading was 120/80. He ended up passing from a ruptured abdominal aneurysm within 30 minutes. Other times the reading could be completely spurious so watch out for trends.
The respiratory rate is on the whole, unreliable. Always measure RR manually as it is the most sensitive indicator of illness and the machine measurement is usually wrong (unless we’re talking about a patient on a ventilator).
The bedside nurses are a great resource on monitors - they have a ton of tricks to setup, interpret and modify the monitor and I’d encourage you to ask them to share their knowledge. Remember, many hospitals have varied setups so although they basically do the same thing the menus and setup are likely different.
One pro tip I learned from my nursing colleagues is that you can adjust the EKG monitor to slow down the rate, this stretches out your EKG and can help distinguish faster rhythms - it can help pull out the sawtooths of atrial flutter. It can help distinguish SVT vs Sinus tach. Spend time with the monitor and it will give you its secrets.


Megan Chu
Latest posts by Megan Chu (see all)
- Requesting Consults in the Emergency Department - July 21, 2020
- How to Read Patient Monitors - June 23, 2020